<div class="statcounter"><a title="Web Analytics" href="https://statcounter.com/" target="_blank"><img class="statcounter" src="https://c.statcounter.com/12795394/0/d64e9537/1/" alt="Web Analytics" referrerPolicy="no-referrer-when-downgrade">

AI Quick Tips 242: Create an infographic from Gemini Canvas

AI Quick Tips

Infographics can be a good way to present a lot of information visually so your audience can make sense of it.

If you use Google Gemini, then you can output to canvas and then create an infographic from there. 


I’ll demonstrate -

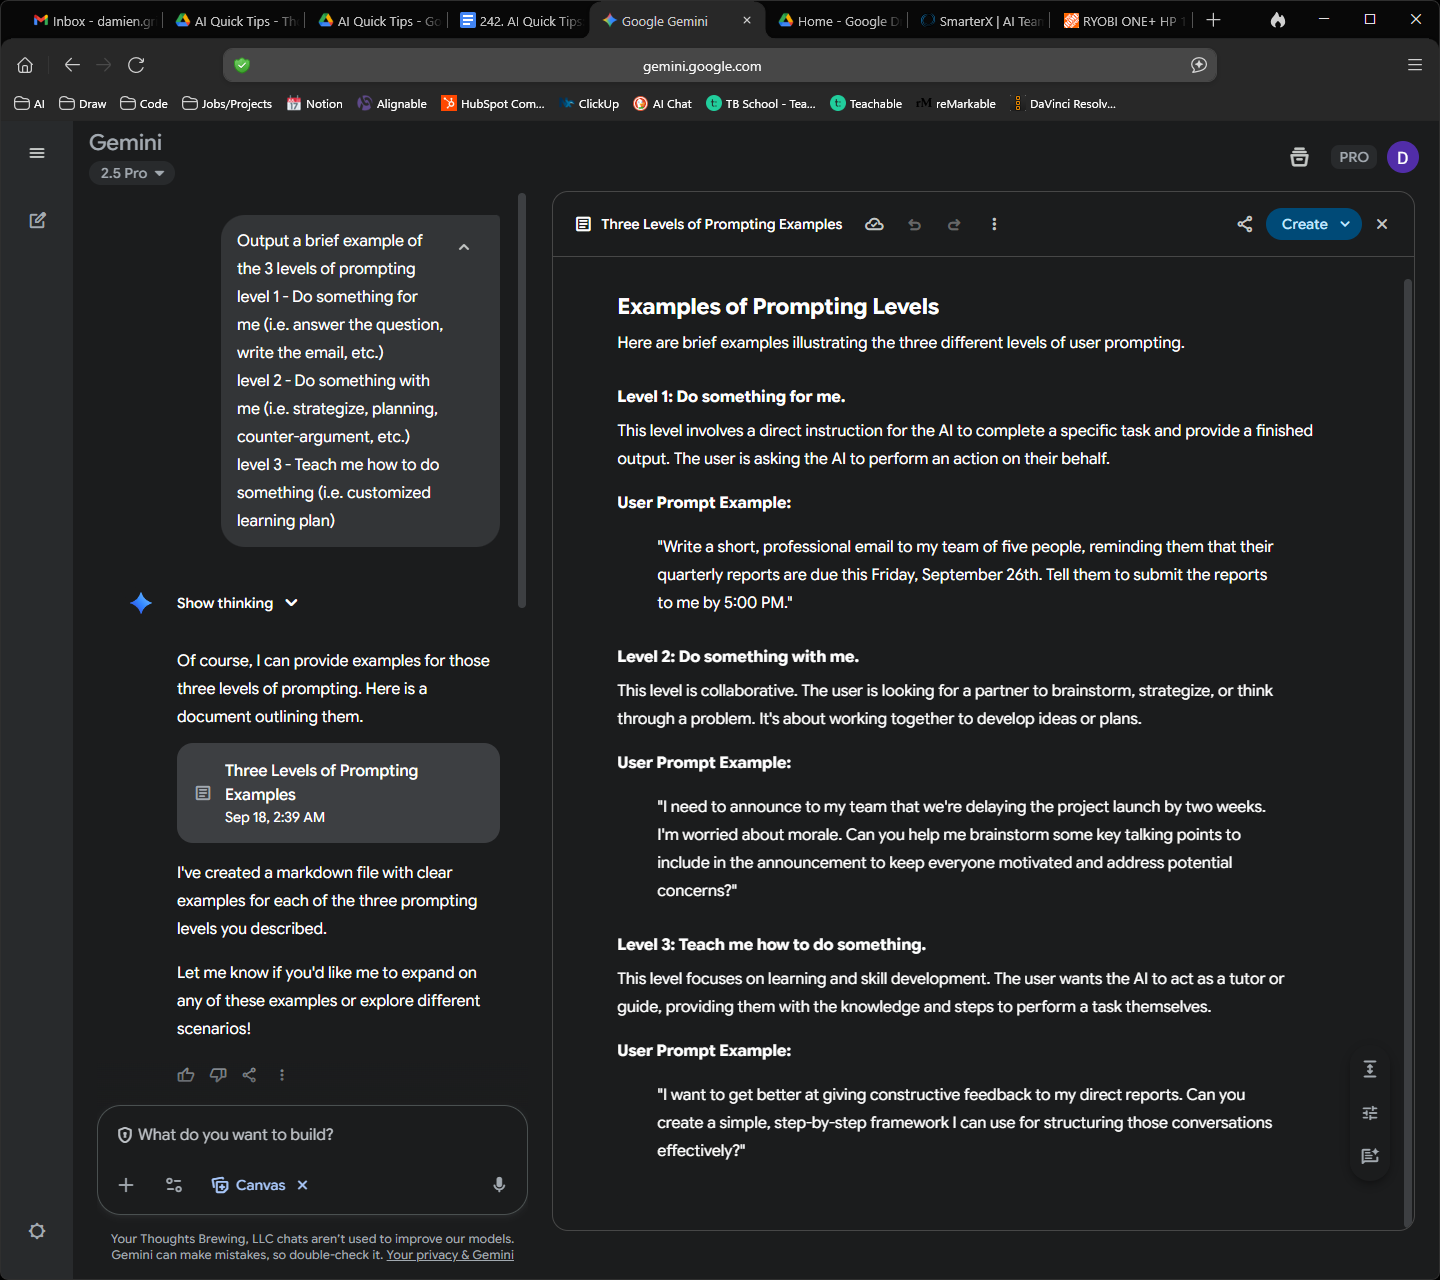
My initial prompt was (I selected Canvas from the tools menu before I put in the prompt)

Output a brief example of the 3 levels of prompting

level 1 - Do something for me (i.e. answer the question, write the email, etc.)

level 2 - Do something with me (i.e. strategize, planning, counter-argument, etc.)

level 3 - Teach me how to do something (i.e. customized learning plan)


Here’s what I got back -

A screenshot of the Google Gemini interface. On the left, a user asks for examples of prompting levels, and Gemini provides a markdown file outlining "Three Levels of Prompting Examples." The right panel displays the full document, detailing Level 1 (Do something for me), Level 2 (Do something with me), and Level 3 (Teach me how to do something), each with user prompt examples.


Then I clicked on the Create menu in the upper right corner and selected Infographic

A screenshot of the Google Gemini interface. An orange arrow points to a dropdown menu under the "Create" button, showing options like "Web page," "Infographic," "Quiz," "Audio Overlay," and "Describe your own app." This highlights the "Infographic" option, indicating how to transform content into a visual format.

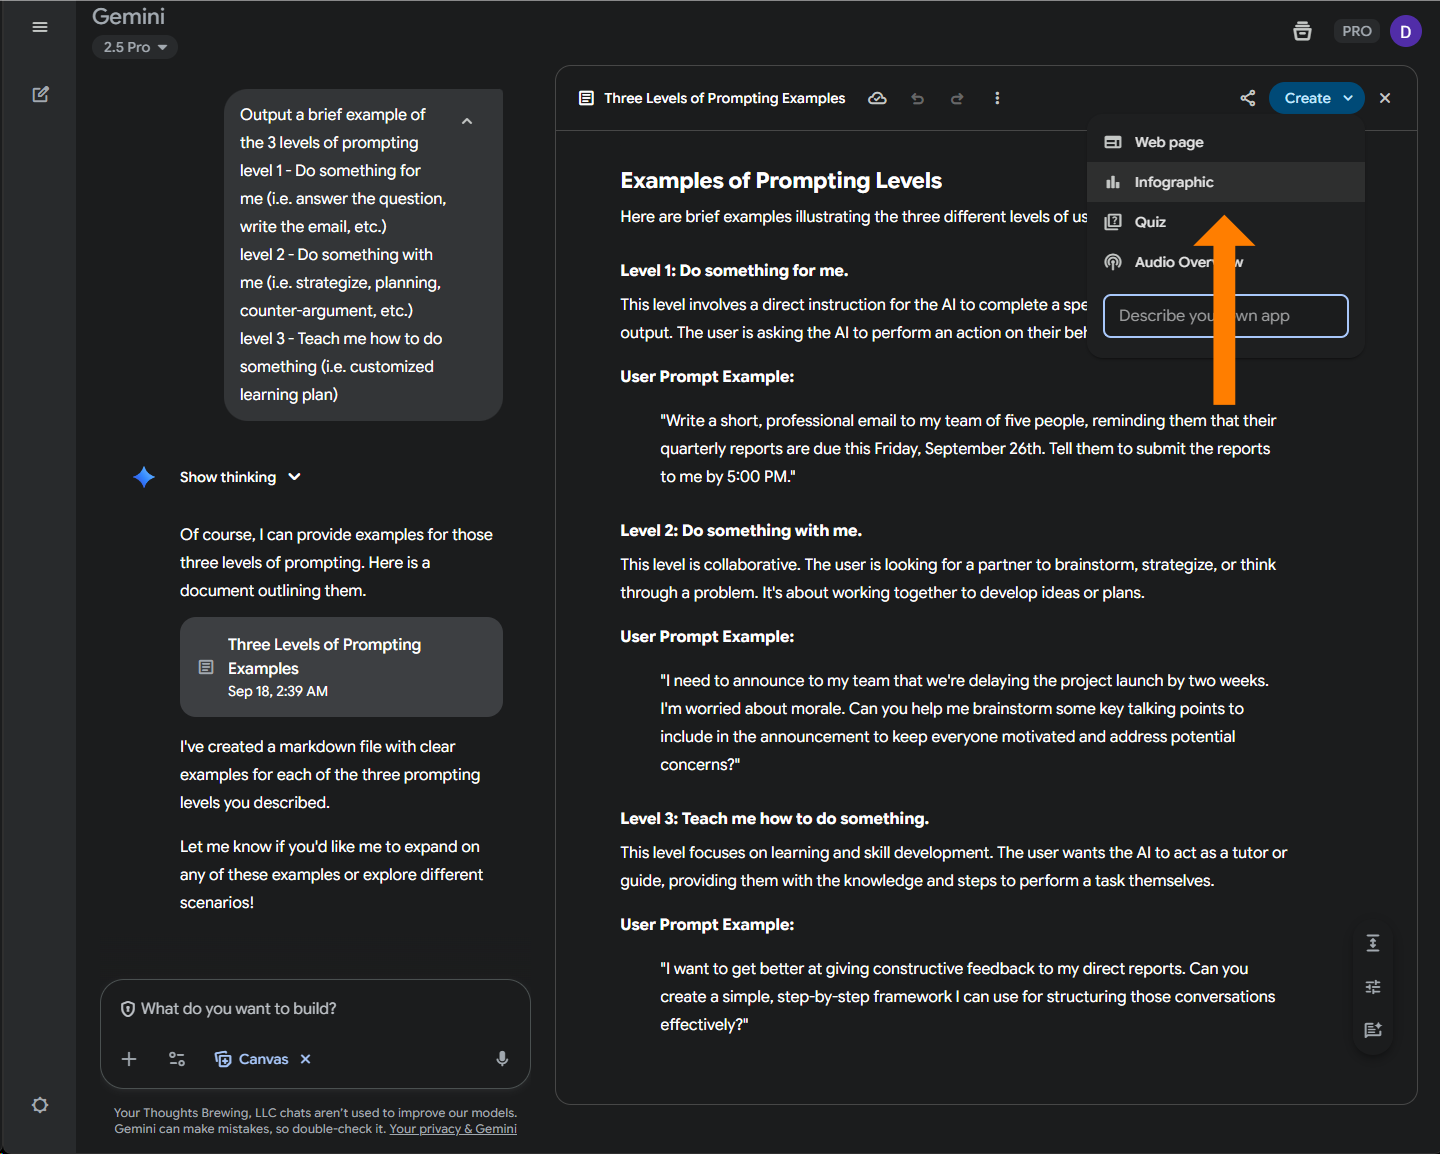
I didn’t add any additional instructions - but know that you can if you want to get more specific.  It will take a minute or two, depending on how complicated your request is and how much data you have.  You’ll see it going through some different coding screens - if you know how to code, you can download the code when it is done and edit it to your liking.

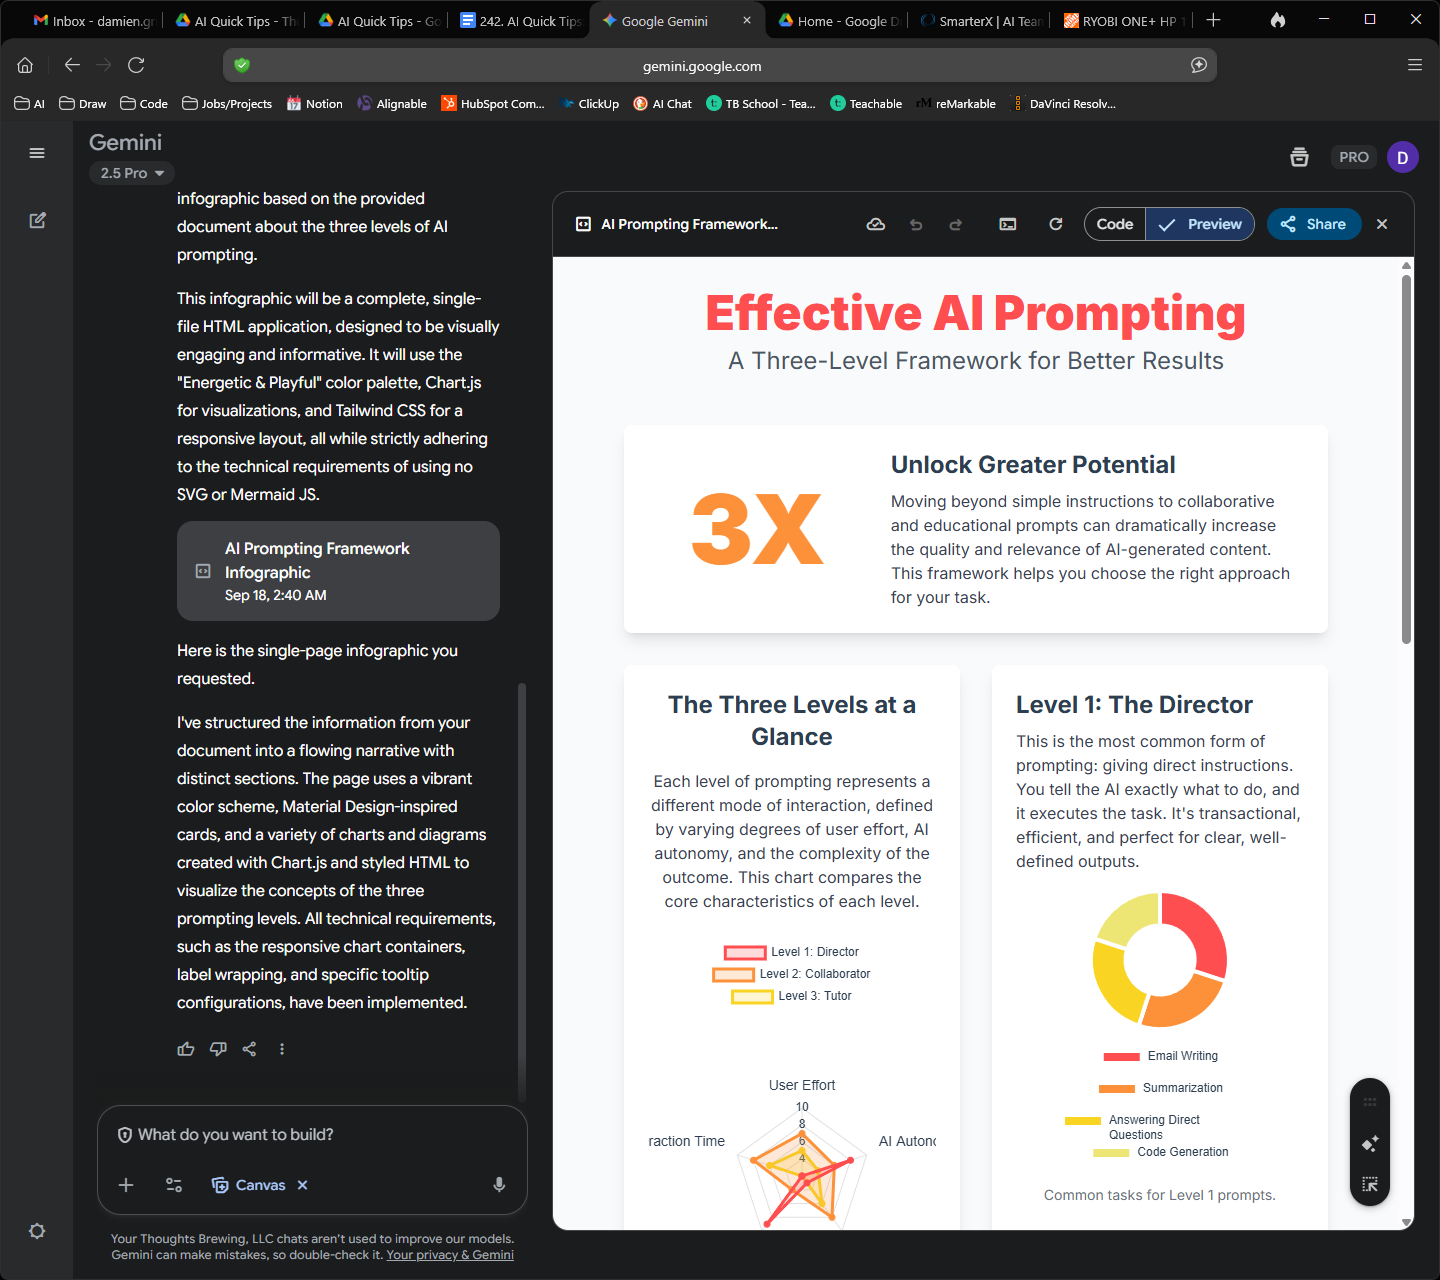
Here is some of what is gave me (the infographic is cut off but I think it shows enough for the demonstration)


Image preview

A screenshot of the Google Gemini interface. It shows an AI-generated infographic titled "Effective AI Prompting: A Three-Level Framework for Better Results." The infographic includes a "Unlock Greater Potential" section, "The Three Levels at a Glance" with a radar chart, and "Level 1: The Director" with a donut chart. On the left, the user's prompt for the infographic and its description are visible.


Code view in canvas

A screenshot of the Google Gemini interface displaying the HTML and CSS code for the "AI Prompting Framework" infographic. The code pane is active, showing the structure and styling of the infographic. This image demonstrates Gemini's ability to generate functional code for visual content.


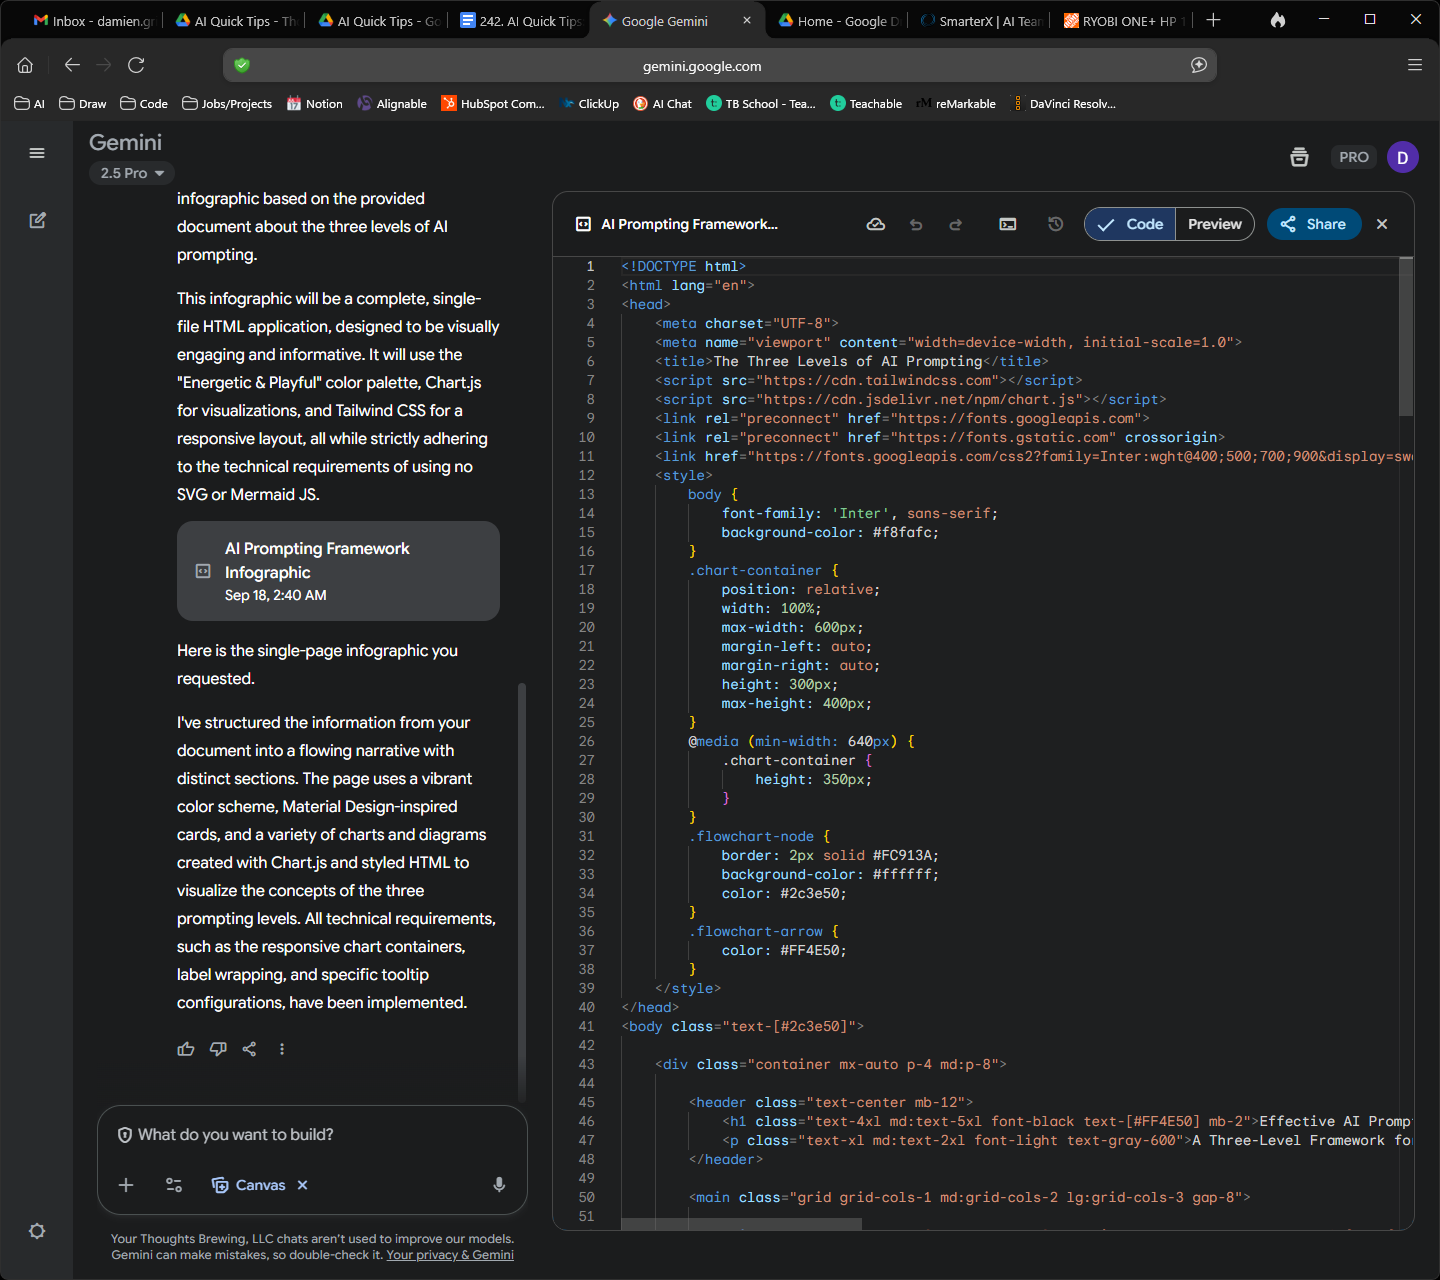
This went from initial prompt to infographic (or code) in less than 1 minute.  


Level-up your skills.  Things are getting competitive…

Comments

Related posts