<div class="statcounter"><a title="Web Analytics" href="https://statcounter.com/" target="_blank"><img class="statcounter" src="https://c.statcounter.com/12795394/0/d64e9537/1/" alt="Web Analytics" referrerPolicy="no-referrer-when-downgrade">

AI Quick Tips 314: NotebookLM got rid of timelines, but you can still make them

A graphic title card on a dark blue background. On the left is an orange robot head with a speech bubble containing the text 'AI'. To the right is a light blue circle containing the words 'Quick Tips'.

Google changes NotebookLM every couple of days. Every now and then, one of those changes rubs people the wrong way. I think that getting rid of timelines is one of those changes.

Ever since they removed timelines from the Studio panel, people have been pretty vocal about how much they used that artifact and that they don’t like the change.


The good news is that you can still make timelines. It just takes a little longer.


I’ll show you 2 ways that you can make them. I’ll assume that you are in NotebookLM with at least one source selected.


If you want a timeline that is all text, go to the Studio panel on the right and select ReportsA screenshot of the NotebookLM "Studio" panel in dark mode. An orange arrow points to the "Reports" button, which now features a pencil "edit" icon in the top right corner, indicating that report formats can be customized.


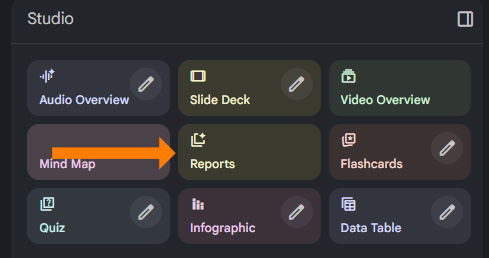
Now choose Create Your Own on the top leftA screenshot of the "Create report" menu in NotebookLM. The "Format" section includes "Create Your Own," "Briefing Doc," "Study Guide," and "Blog Post". The "Suggested Format" section displays cards for "Strategic Roadmap," "Implementation Plan," "Educational Guide," and "Summary Report," each with a pencil icon to allow for further customization.


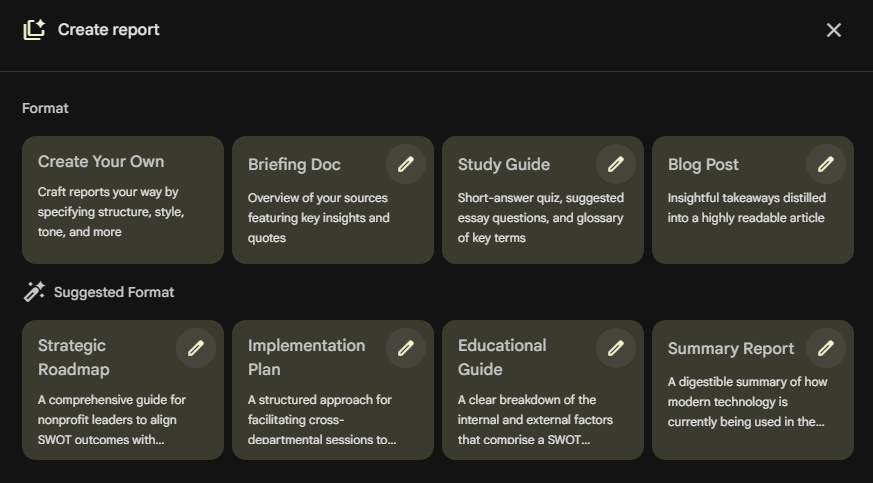
In the Describe section, give it instructions for the timeline that you want it to createA screenshot of the "Create report" customization screen. A dropdown menu allows users to "Choose language" (with English set as default). Below this, a text box titled "Describe the report you want to create" provides an example of a formal competitive review for a 2026 wellness drink, focusing on distribution and pricing.


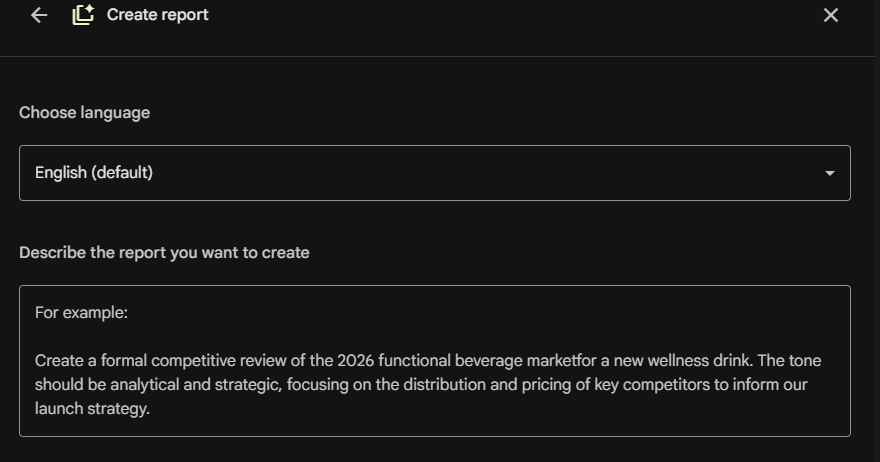
The other option is if you want a visual timeline. You can create an infographicA screenshot of the NotebookLM "Studio" panel with an orange arrow pointing to a pencil "edit" icon on the "Infographic" button. Similar pencil icons are visible on the buttons for Audio Overview, Slide Deck, Video Overview, Reports, Flashcards, Quiz, and Data Table, showing that nearly every Studio output can now be tailored.


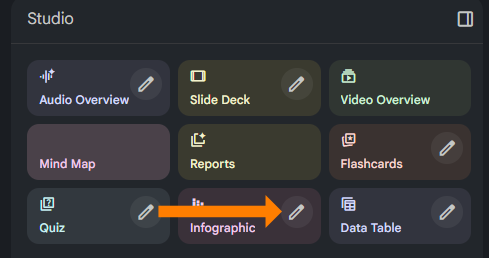
Click on the pencil to get the customized window (or if your UI has updated, it may now look like an arrow > instead of a pencil). Choose your visual style and describe the type of timeline that you want.


Make sure that in either case that you specify “timeline” somewhere in the instructions since it isn’t a default anymore.


prefer video? Watch here ↓


NotebookLM Weekend Masterclass - Cohort 2 no Dates

Turn NotebookLM Into Something Useful

Go from “this seems cool” to actually using it for research, content, and decisions. 

Comments

Related posts